Data Analysis and Scaling
 INTRODUCTORY
” You should look at this section if you have only a limited understanding of data analysis and scaling.”
The purpose of assessment – including the development of assessment materials and the implementation of fieldwork – is to collect data that indicate students’ skills and knowledge. Collecting data is only the first step, however. Two common mistakes in many assessment programmes are to (1) fail to undertake data analysis in a timely manner; and/or to (2) use inappropriate approaches to data analysis which generate invalid insights from the data.
The aim of data analysis is to derive useful information that can assist with educational decision making processes (both in relation to policy and practice). Data analysis involves applying statistical techniques in a systematic way to describe and summarise data. The approach to data analysis is driven by the objectives of the assessment programme.
At the classroom or school level, data analysis can be done quite simply, using straightforward descriptive analysis of raw scores in software such as Excel. This can, for example, identify patterns such as what percentage of students achieved each grade. This kind of analysis can be done by anyone with a basic understanding of how to use Excel or an equivalent programme and need only to involve straightforward frequency tables.
In large scale assessment programmes, however, different approaches are required and data analysts need advanced skills (a Master’s degree or PhD in a relevant subject, plus additional training) and to use advanced statistical packages such as SPSS, STATA or R. One of the critical elements of advanced data analysis is that all raw data must undergo a rigorous process of data cleaning prior to analysis.
One of the advantages of using sophisticated approaches to data analysis is the possibility of scaling.refers to the process of determining a scale against which student performance can be measured. This is similar to using a thermometer to show temperature on a pre-determined gauge. The example below is taken from the report on Class 3 Proficiency in Afghanistan 2015-2016 under the MTEG project (https://research.acer.edu.au/mteg/17/).
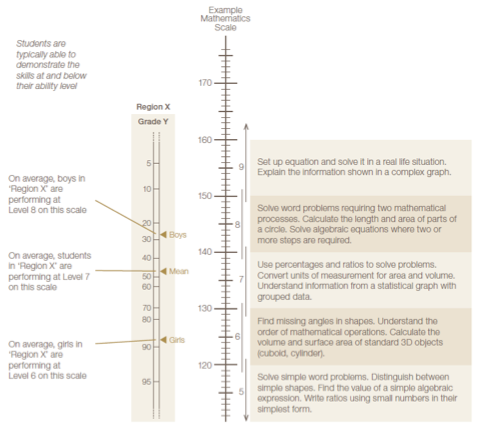
It illustrates the common features of a scale including the performance bands on the right with band descriptions and the scale on the left. Student performance on a test is then converted into scale scores and is shown on the scale. In this instance, in region X it is possible to see that boys perform better at mathematics than girls. The detailed information about what students are able to do and not do gives education professionals insights into what areas need more focus if educational achievement is to be improved.
Whatever the approach used to the analysis of assessment data, it should be carefully aligned with the purpose of the assessment. The choice should also take into account the availability of skilled staff. Scaling requires a high level of technical expertise and this is often not available at the district, state or even national level. It should not be attempted unless relevant skills are available.
To find out more about data analysis and scaling, move to #Intermediate.
 INTERMEDIATE
“You should look at this section if you already know something about data analysis and scaling but would like to know more.”
There is no such thing as a perfect approach to the analysis of assessment data. Instead, decisions about how to analyse the data should selected based on the purpose of the assessment programme. A common problem in assessment programmes is that the incorrect type of analysis is undertaken for the purpose of the assessment.
For school or classroom based assessments, simple descriptive analysis of raw scores using a software such as Excel is sufficient. The focus might be simply on what percentage of students achieved which grade; the proportion of students that responded correctly to each item; or whether there is any difference between the performance of girls and boys (or other sub-groups).
If the data analysed is based on Multiple Choice Items (MCQs in which distractors have been designed to highlight misconceptions, then common reasons for wrong answer can also be highlighted (for example if the key is A and most students chose C then the misconception that C represents needs to be addressed in class).
It is important to understand that data on student performance SHOULD NOT be used to identify the strengths and weaknesses of teachers. There are a large number of factors that influence student performance, many of which are outside of the influence of the teacher, and so linking student performance to teacher is extremely misleading.
It is relatively common for large scale assessment to use simple descriptive analysis using raw scores. The rationale given is often that this is ‘quicker’ or ‘cheaper’ than using alternative methods. This is incorrect, however. Simplistic analysis of data tends to lead to misleading findings, undermining the ability of the assessment programme to accurately inform improvements in education (hence actually leading to slower and more expensive progress than otherwise would have been achieved).
Instead, all raw data must undergo a rigorous process of data cleaning prior to analysis. The basic rule is ‘rubbish in, rubbish out’ – if raw data is used in data analysis then the results are very unlikely to present an accurate picture of student skills and knowledge.
The greatest value from an assessment programme is achieved if student performance is reported using scale scores. Scaling involves developing a common unit of measurement and then converting student performance to scale scores and showing them on the scale. Common approaches are Classical Test Theory (CTT) and Item Response Theory (IRT).
The example below is taken from the report on Class 3 Proficiency in Afghanistan 2015-2016 under the MTEG project (https://research.acer.edu.au/mteg/17/).
It illustrates the common features of a scale including the performance bands on the right with band descriptions and the scale on the left. In this instance, in region X it is possible to see that boys perform better at mathematics than girls. The detailed information about what students are able to do and not do gives education professionals insights into what areas need more focus if educational achievement is to be improved.
The advantage of using scales for reporting is that they include precise descriptions of what students in a particular cohort can and cannot do in a particular subject. This provides educational stakeholders with clear insights into which learning outcomes or parts of the curriculum require more emphasis. It also helps indicate which cohorts of students require more support than others.
The use of scales also enables comparisons to be made between students in different grade levels and/or across different years. It is also possible to equate tests – that is, to link different tests together by adjusting for differences in difficulty.
To find out more about data analysis and scaling, move to #Advanced.

 ADVANCED
“You should look at this section if you are already familiar with a range of different forms of data analysis.”
The more complex and large scale an assessment programme, the more advanced data analysis techniques are required, particularly to ensure that any comparisons are valid. While simple descriptive analysis of raw scores may be suitable at the small scale (for example for school or classroom assessments) this is not the case at the larger scale.
Complex elements may include the application of weights to enable results to be compared across different sub-groups, replication to produce accurate standard errors accounting for the design effect of sampling, and drawing on contextual information to inform output. Plausible values are used for any national or international comparisons.
The greatest value from an assessment programme is achieved if student performance is reported using scale scores. Scaling involves developing a common unit of measurement and then converting student performance to scale scores and showing them on the scale. Common approaches are Classical Test Theory (CTT) and Item Response Theory (IRT).
The advantage of using scales for reporting is that they include precise descriptions of what students in a particular cohort can and cannot do in a particular subject. The performance of different groups of students can also be placed on the same scale. This enables comparisons to be made between students in different grade levels and/or across different years. Scaling also enables the possibility of equating different tests.
Scaling is a complex process that involves many different components. These include scale calibration to estimate the parameters of the model. This includes:
- Item review and weighting;
- Estimating the model fit of items using the weighted mean-square statistic (infit);
- Using item-person maps to identify how well the test is targeted;
- Using differential item functioning to identify any items that favour student cohorts;
- Determining which items should be used as anchor items between tests.
It is important to note that these processes need to be run BOTH after piloting AND after the main fieldwork. Indeed, a key purpose of piloting is to generate sufficient data to enable revisions to be made on the basis of what scaling analysis indicates.
After paying attention to items, the next step in scaling is to compute student scores. This can be done for either individual students or for cohorts of students depending on the purpose (and, hence, design) of the assessment programme. Different approaches to the estimate of student ability include point estimates and plausible values. Each approach has strengths and weaknesses that make it most suitable for particular purposes. For example, a set of five plausible values is not the best approach for individual scores but is suitable in describing the performance of a student population.
Once student scores have been placed on a scale, proficiency bands (or levels) can be created, each of which has a detailed descriptor explaining what students at this level are expected to be able to do. They are also assumed to be able to have the skills and knowledge included in all lower bands. Proficiency bands can also be used as a basis for standard setting.
About the guidance levels